In the field of history, GIS (Geographic Information System) is a well-known type of software. Already the term HGIS (the extra H stands for historical) is being coined to describe the usage of GIS by historians. So why do historians use it and what are its advantages?
GIS in historical research
For those who have never heard of GIS, I recommend to watch this brief introduction. To quickly describe it, GIS is a software which lets users work with spatial data such as coordinates, add other kinds of data to it such as temperature of the name of a city, and then besides visualizing the results on the map, it can also be a tool to analyse these results. GIS is not just a map making tool, it also comes with a database in which all kinds of data can be stored and manipulated. There are multiple GIS out there, such as ArcGIS and QGIS. I personally make use of the latter, as it is open-source and therefore free to use.
In the field of history, GIS enables historians to work with vast amounts of data that can also be complex and heterogeneous. An example of this is a research done by Robert M. Schwarz and Thomas Thevenin about the relationship between the presence of railroads and agricultural production between 1850-1914, comparing the situation of Great Britain with that of France. In this research, GIS was used to link data from two different kinds of sectors and even from two separate countries, thereby displaying relationships that we did not notice before. In this way, it can possibly further our insight in certain issues.
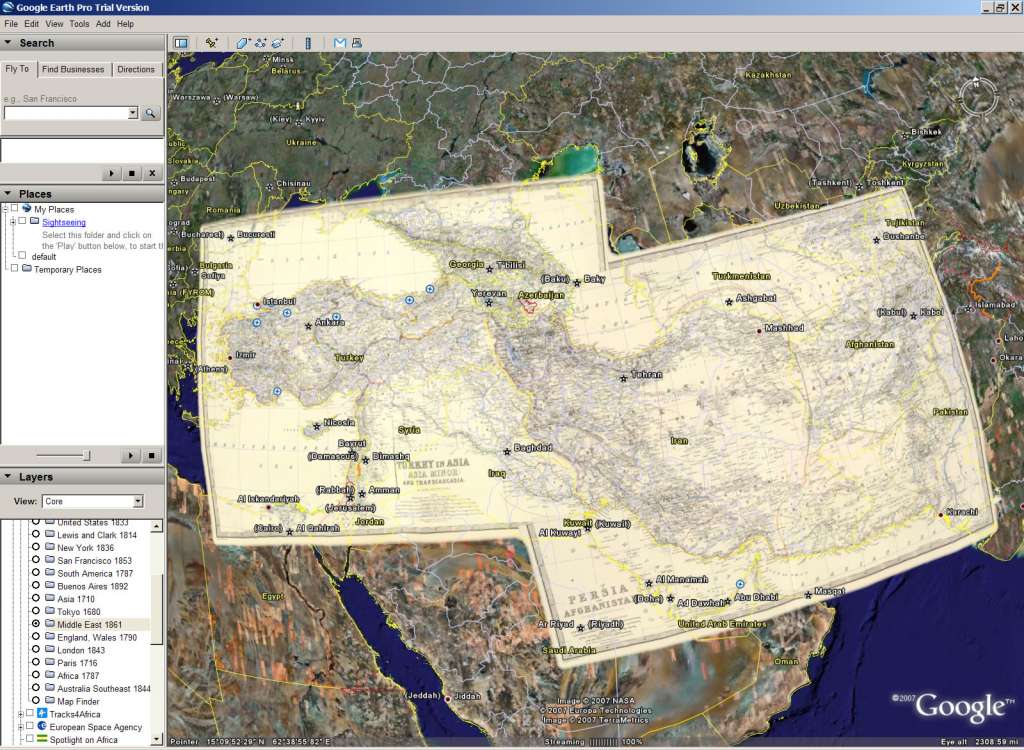
Another possibility that GIS offers for historical research is to overlay historical maps over current geographical situations. GIS can work with a georeferencer which allows users to overlay a historical map on a modern-day map. Because of this, historians can closely observe and compare the geographical situation of a certain city or even street or house between then and now.
GIS has even more to offer, but the above mentioned functions are from my point of view the most important for historical research.
Public history and storymaps
It seems that GIS can also enable historians to share their research with a wider audience. There are a lot of examples of HGIS projects created by scholars which are shared online. The project Mapping Medieval Chester, which brought together scholars from multiple disciplines, published a digital map on their website to improve general access to the project (unfortunately, at the moment of writing the link seems to be broken). Another project which has to be mentioned here is ORBIS, made by scholars of Stanford University. Although it is based on Gephi instead of GIS, it is also a very good example of how academic historians can use maps to create an interactive window for the public to actively engage in history and the issues historians think about everyday.
The downside of projects like those mentioned above might be that the maps become too much the centre of attention, where researchers in the humanities want to focus more on narrative and description. A possibility here might be to create a storymap, which is basically an online article where writing and multimedia are combined with interactive maps. To see some examples of this, the library of congress has created a series of storymaps in which they expand on several historical subjects, from fifteenth-century printing to D-Day. Just scrolling through these articles shows the power of this tool, as the elements in the article are working together to create an interactive way of storytelling combined with interactive maps.
As a personal user of QGIS, I became interested in how the usage of GIS can be combined with the concept of storymaps. This is why I decided to dive into it and create a simple storymap myself. There are multiple services out there that offer the opportunity to create a storymap, but I choose for the service of ArcGIS. My main motivation here is that the service allows me to upload shapefiles, which are commonly used in GIS. I thus can work with GIS data in QGIS, and then export my results into the storymaps. This comes in handy when we work on a project in GIS and later want to directly share our findings into a storymap.
My personal experience with the tool is that is creates engaging articles which might also interest a wider audience into topics they would not care about at first. Although the maps have a genuine function in the article, they do not take over the story but merely function as a tool to help bring the point across.
I have some concerns however. When I tried to upload a larger file, it refused me to do this and wanted me to get a paid subscription to the service. This is then for me the downside of this particular service, as there is a commercial interest behind the provider of the tool. We might consider paying for this service, but an argument against this is that it can make us dependent on its provider. A better option might be to work with open-source alternatives like Knight Lab. Unfortunately, at this point this service seems to lack the options and advantages that ArcGIS already offers and that I think make the storymaps such an interesting concept.
Bibliography
- Ian N. Gregory and Alistair Geddes (Ed.), Towards Spatial Humanities : Historical GIS and Spatial History, (Bloomington 2014).
- Robert M. Schwarz and Thomas Thevenin, ‘Railways and Agriculture in France and Great Britain, 1850-1914’, in: Ian N. Gregory and Alistair Geddes (Ed.), Towards Spatial Humanities : Historical GIS and Spatial History, (Bloomington 2014) 4-34.
Images
- Kevin Jarrett, ‘The Middle East in 1861’ (online image) <https://www.flickr.com/photos/29304822@N00/396228703>.

1 Response
[…] This blog was written for my university course; the original post can be found here. […]